The second half of the year is off to a nasty start, with the Dow DJIA, -0.57% and the S&P SPX, -0.50% getting hammered Monday by escalating trade jitters. The Nasdaq COMP, -0.81% is also in the red, but just barely.
Nevertheless, J.C. Parets, the technical analyst behind the All Star Charts blog, says “it’s hard to be bearish stocks.” Yes, with Trump showing no signs of tapping the brakes on tariffs and Wilbur Ross saying the president won’t be swayed by a weakening market, Parets is confident we’re headed for higher ground.
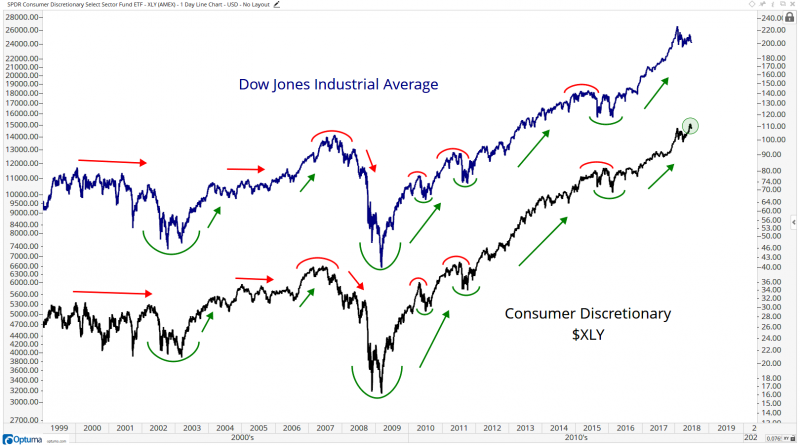
Why? This chart:
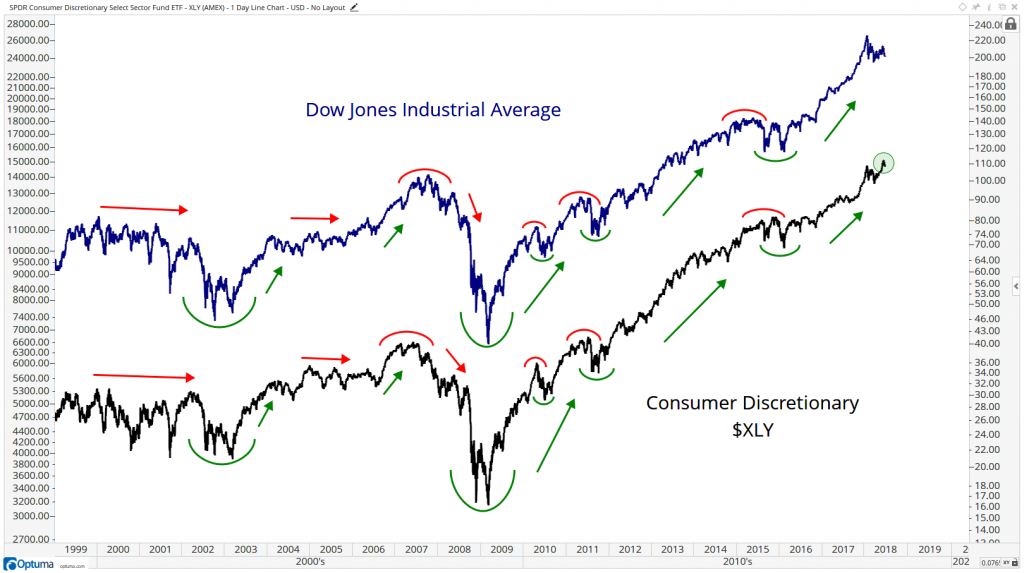
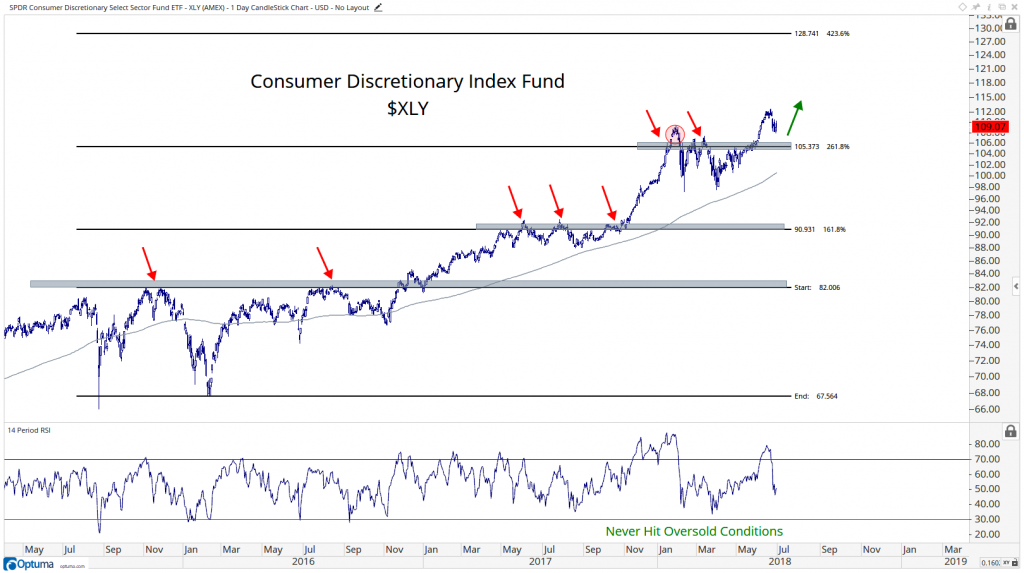
Parets explains that the consumer discretionaries sector XLY, -0.55% has long been a great indicator of market strength, and the group’s recent breakout to fresh record highs, as you can see from the chart above, should signal more gains to come for the broader market.
Drilling into the trend lines reveals that the 105 level, according to Parets, is critical in determining the next move. “That is where prices struggled throughout the year until more recently,” he said. “The bet here is that we’re just now starting a new leg higher.”
Amazon AMZN, -0.98% represents 22% of the entire index, so the XLY’s performance has obviously been driven by the e-tailer’s nosebleed climb. The same can actually be said for the broader S&P, where the stock is responsible for 36% of the index’s year-to date-return (check out “the stat of the day” in our daily “Need to Know” column).
But Parets backed out Amazon from the XLY and found that, even without the massive boost, “we are in the midst of what could be the end of a 3-year relative downtrend,” as illustrated in this chart:
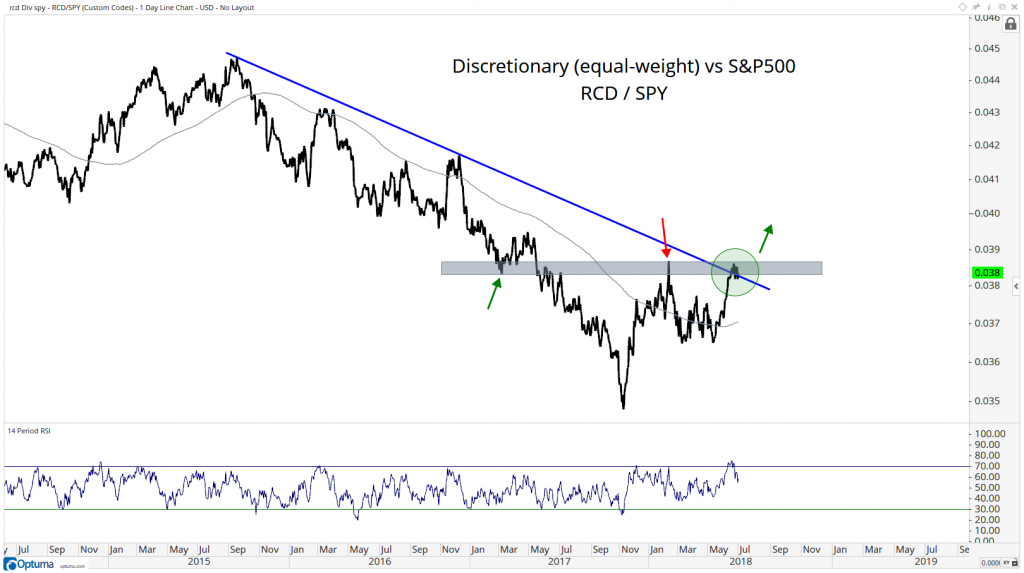
“A breakout here would be confirmation that “discretionaries,” as a group, are heading higher, and therefore very difficult to be bearish stocks,” Parets concluded. “I think we rally.”