The Symmetrical Triangle is a chart pattern that is recognized by the distinct shape created by two converging trend-lines. The pattern is identified by drawing two trend-lines that connect a series of sequentially lower peaks and a series of sequentially higher troughs. Both trend-lines act as support and resistance levels that prevent the price from heading higher or lower, but once the price breaks either of these levels, a volatile directional move often follows.
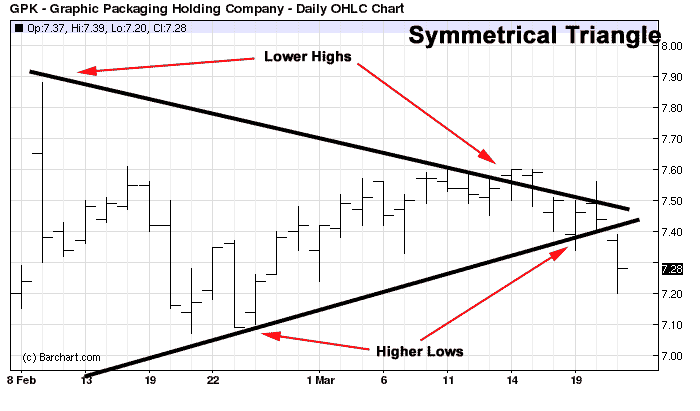
Both trend lines are symmetrical.
The Symmetrical Triangle is generally regarded as a period of consolidation before the price moves beyond the support or resistance trend-lines. A break below the support trend-line is used to signal a price break to the downside, while a break above the resistance trend-line signals a breakout to the upside.
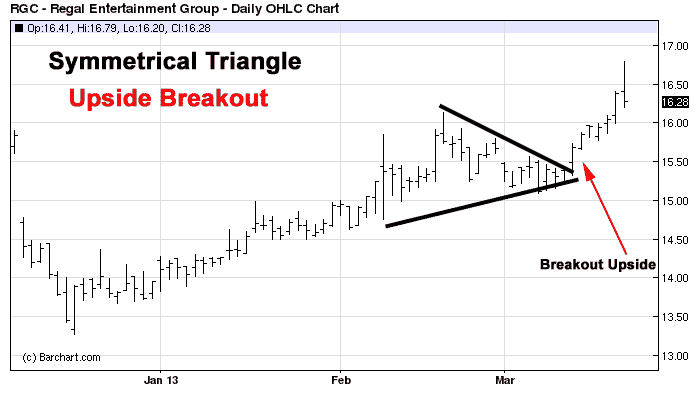
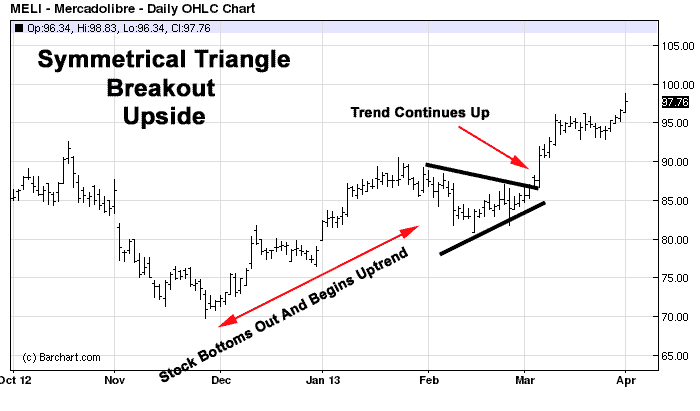
Example of breakout to the upside
How To Achieve Best Results With Symmetrical Triangles
This is where most traders get into big trouble, knowing under what market conditions to use this pattern for best results. Most trading books will tell you to that the Symmetrical Triangle is a continuation pattern; this means that you should take trades in the direction of the trend after a strong move is already under way. This is how I utilize both the ascending and descending triangles as well as the symmetrical triangle.
I find that many traders use this method for trading reversals instead of continuation patterns and that’s not something this pattern is designed for. The best time to trade symmetrical triangles is after the stock or other market you are trading has developed a trend towards a particular direction. You should then only take symmetrical triangle breakouts in the direction of that trend.
Notice in this particular example how the stock topped out after a strong up trend and is beginning to come down slowly. This is the perfect opportunity to trade breakouts to the downside or breakdowns as they are called.
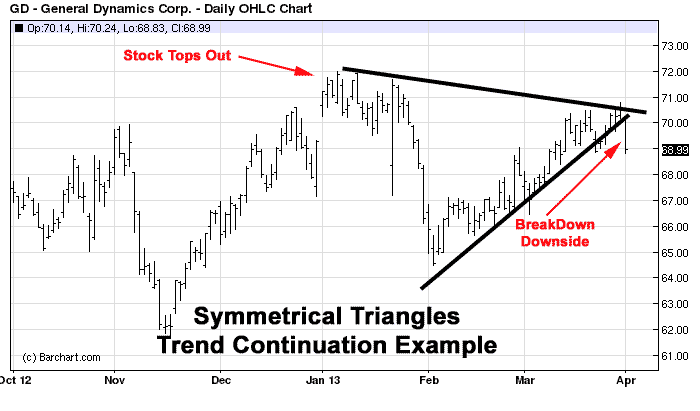
This stock topped out and begins to move downward
In this example the stock bottoms out after a strong downtrend and begins to trend up again. You can tell by looking at the chart that the uptrend is mature and the stock already clearly reversed direction. This is the type of trading environment you want to see prior to trading Symmetrical Triangle patterns.
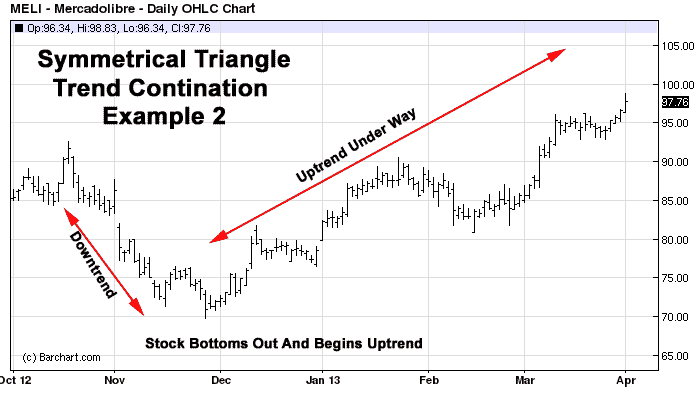
The uptrend is well underway in this example
This is what a proper technical analysis pattern should look like. Often time’s traders forget that the Symmetrical Triangle is a way for the market to pause before continuing a move in the same direction. You should avoid taking trades if you cannot tell which way the market is headed prior to the formation of this pattern.
The pattern can take anywhere from two weeks to two months to complete.
Here is another example of how a breakout from a Symmetrical Triangle should look like. Keep in mind that this is a subjective pattern so it won’t form perfectly each and every time. The important thing to remember is the pattern is a way to identify consolidation periods after a strong move has already occurred in the direction you’re planning on taking your trade.
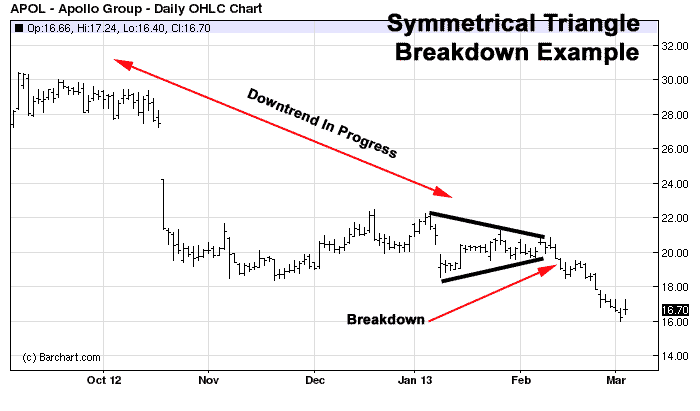
The downtrend was developed prior to triangle formation.
Things To Remember
The Symmetrical Triangle is one of the most traded patterns and works great when you follow simple rules. Remember to use the pattern for continuations as opposed to reversals. Also, keep in mind that the pattern can take anywhere from 2 months to two weeks to set up correctly. The longer the pattern sets up the better the odds of a strong move in one direction. Lastly, the pattern can be applied to stocks, futures, commodities and currencies.